The choice of AMD or NVIDIA graphics is constantly becoming a difficult choice for enthusiasts thanks to an almost level playing field as a result of strong competition between AMD and NVIDIA.
Both brands ave their pros and cons but offer a very similar experience. Choice has become a more personal one, often of brand loyalty than technical.
Add in board partners are constantly releasing custom design graphics cards which squeeze every bit of performance and cooling for both brands equally.
HAWK - MSI's second highest model line (there is Gaming, Hawk and Lightning) offers strong overclocking and tweaking without being too intimidating to the enthusiast who isn't into modding or custom cooling. Their latest version is no exception.
In our fly-off, we were quite impressed with the speed and handling of both the AMD Radeon R9 270X and NVIDIA GeForce GTX 760 based MSI HAWK cards.
Out of the two cards, neither was the outright winner. The winner, however is the consumer. Read on to find out why.
Overview
These cards cater for a more enthusiast audience who are familiar with tweaking their graphics card's clock speeds and voltages It would be fair to call both cards reviewed here heavy duty high performance parts. Both offer full voltage adjustments which are not available on reference cards.
| Name | N760 Hawk | R9 270X HAWK |
|---|---|---|
| GPU | NVIDIA GeForce GTX 760 | AMD Radeon R9 270X |
| Codename | GK104 | Curacao XT |
| Processors | 1152 | 1280 |
| GPU Base Clock | 1111 MHz | 1100 MHz |
| GPU Boost Clock | 1176 MHz | 1150 MHz |
| Memory Clock | 6008 MHz | 5600 MHz |
| Memory Size | 2048 MB GDDR5 | 2048 MB GDDR5 |
| Memory Bus | 256 bits | 256 bits |
| Output | DisplayPort / HDMI / DL-DVI-D / DL-DVI-I | DisplayPort / HDMI / DL-DVI-D / DL-DVI-I |
| Power Consumption | 170 W | 161 W |
| Card Dimension | 264x130x40 mm | 263x136x38 mm |
| Form Factor | ATX | ATX |
| DirectX | 11.0 | 11.2 |
| OpenGL | 4.3 | 4.3 |
| Multi-GPU Technology | 3 Way SLI | AMD CrossFire technology |
| Multi-Display Technology | 3-Way Surround | AMD Eyefinity technology |
| 3D Technology | 3D Vision | AMD HD3D technology |
| Power Saving Technology | Y |
AMD ZeroCore Power technology AMD PowerTune technology |
| HDCP Capable | Y | Y |
| GPGPU technology | CUDA/PhsyX | OpenCL/AMD APP Acceleration |
| Power Supply | 500W | 500W with 12 volt at 30 amps |


While the cards themselves are fascinating, the actual retail bundle leaves much to be desired. The usual 'throw-away' driver/application/norton anti virus CD, a generic quick start guide and DVI-VGA adapter are bundled.
It would have been beneficial to the enthusiast target buyer to include some extra adapters or cables as ASrock and Sapphire do.
As far as software goes, to utilise the full voltage adjustment features of the HAWK, Afterburner beta 17 is required which was made available after the cards release.


Design and Features
MSI's HAWK brand embodies several key features:
"OC Certified" Factory burn in testing
MSI claims its 24 hour overclock testing at 45 degrees ambient helps to ensure stability for the end user. When first announced for their over-clocking oriented motherboards, this claim drew some criticism as it was seen as a gimmick especially at the temperature mentioned
Our point of view is ANY testing of each individual item is welcome, as for some brands only a sample of production are subjected to thorough tests.
Twin BIOS
MSI's higher end cards ship with two BIOS profiles with a hard switch. The 2nd position is labelled 'LN2' which we feel is misleading as while the temps are high during extreme overclock, air is still usable.
: Base 1111 MHz Boost 1176 MHz Memory 1502 MHz")
: Base 980 MHz Boost 1033 MHz Memory 1502 MHz")
Why is LN2 mode slower on the NVIDIA card? To encourage higher boost speeds thanks to the enhanced power and cooling systems. Under LN2 mode, power limit is unlocked, up to 185%.
On NVIDIA Kepler based cards, the Boost speed resembles a sliding window. You are guaranteed to get a boost speed of say 1176 MHz out of the box, but the card can go even higher, to the high 1100s and low 1200 MHz range provided limits are not reached. We call this overboost.
This system is unlike Intel's turbo boost technology which has fixed ratios which define how fast the CPU can run in different conditions.
Although NVIDIA have briefly commented in the press about Project Greenlight, NVIDIA's APAC office told us that they 'could not find any information' on Greenlight and seemed unfamiliar with the concept, despite their executives previously discussing this with tech press.
Things are a bit more straight forward with Radeon overclocking.
R9 270X HAWK Default: Base 1150 MHz Memory 1400 MHz
 1150 MHz Memory 1400 MHz. LN2 mode is the same")
Enhanced Power
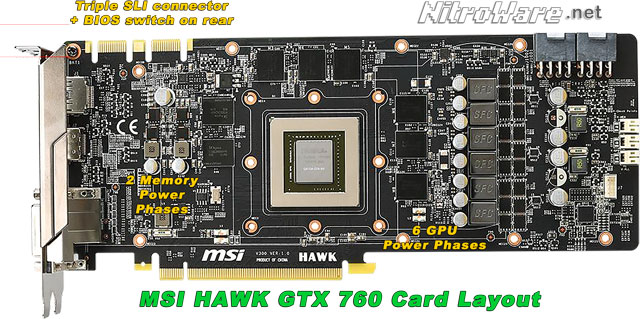
This is where things get interesting. the GTX 760 HAWK's power design can output up to 200 amps using 6 phases for the GPU and 2 for the memory, up from 150A and 4+1 phases for the reference card.
TWO 8-pin connectors are fitted, which in theory can supply the card 375 watts of power if the card's power circuitry could handle this.
At first we thought this was a gimmick and with the BIOS in normal mode the card with can not stretch its legs with a 111% power limit. LN2 mode enables 185% power, removing this constraint.
While power draw is very high at 185%, 370 watts in Furmark at 1.3 volts and overclocked, the two 8 pin overall do not have to be used if you do not want to. MSI bundle two 6pin to 8pin adapters and the card runs just fine with just two 6 pin power without adapters. Both cards are 160/170 watts out of the box well within the scope of a PSU with two 6 pin connectors.
For the R9 270X, the cards taller form factor was used for more power phases, supplying the GPU up to 320 amps current using 8 phases, 2 memory phases, 1 for Phase Lock Loop and 1 for PCI express bus.
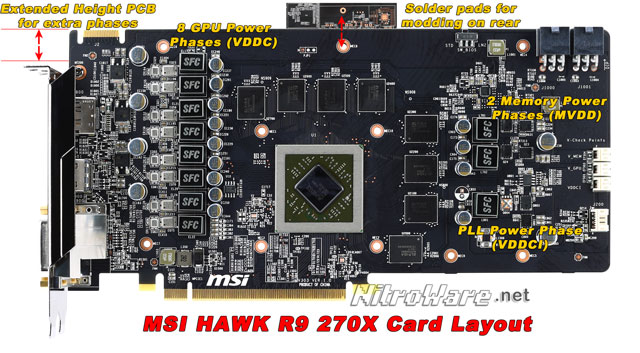
Although a stronger power system on paper, the 270X only uses two 6 pin connectors. It's added height is not a problem for roomy 'gaming' towers but please check your case clearance for this card, especially if you have fans in your case lid.
The 270X does have one nice feature the 760 does not, a carry over from the older 7870 HAWK. A cool set of LEDs indicate the number of active power phases.

Both cards use a 8 layer PCB.
Advanced Thermal Design
Both cards built upon MSI's popular and proven Twin Frozr tech and implement dual PWM 'propeller blade' fans, dust removal, nickel plated copper parts including 8mm 'superpipes' and dual 'form in one' back and front heatsinks.
Some brands such as Gigabyte do not provide two monitored fans on their GPU so it pays to check the GPU you are buying have two true PWM fans.
In our subjective testing the fans stayed quiet and provided good cooling. MSI claim their 760 HAWK is 16.48dB quieter and 10c cooler; and their 270X 20.64 dB idle, 21.35dB load plus 6c coooler than reference.
MSI claim arched and rounded edges, grooved blades, small arc and gloss coating contribute to 20% more airflow.

The dust removal technology comprises of running the fans in reverse during boot up only. This is evident on the 270X as the phase LEDs are off when the fans are reversed.
The nickel plating aids aesthetics, helps to prevent corrosion of exposed parts and a slightly smoother thermal interface surface.
The dual form in one heatsinks provide cooling, rigidity and protection to the cards. One problem associated with all longer graphics cards is warping and sagging of the PCB. Some brands fit a small metal edge bracket but this is often insufficient.


When a PCB warps, traces or solder connections can break (Dry joints), cooling fan bearings can wear quicker and the board can be difficult to install on occasion.
There are two main ways to prevent PCB sagging:
-
Affix an equal length heatsink to the PCB, attached at multiple points. The current GeForce GTX reference heatsink does this, and the reference PCB has multiple screw holes however some brands chose to save money and only attach the heat-sink using 4 screws around the GPU, putting all the weight on the PCB under the GPU itself.
-
Use a front and back full size bracket to brace the PCB. This what MSI have done here. Not only is the PCB 'dead straight' and very easy to fit but it also looks good too and provides protection to the PCB for those who are constantly removing their GPU.
"Practice what you preach" is often law in tech, while MSI put ffort into their thermal solution, the production and Q.A lines didn't get the memo.
For those who are interested in the quality of the factory thermal paste, see for yourself.


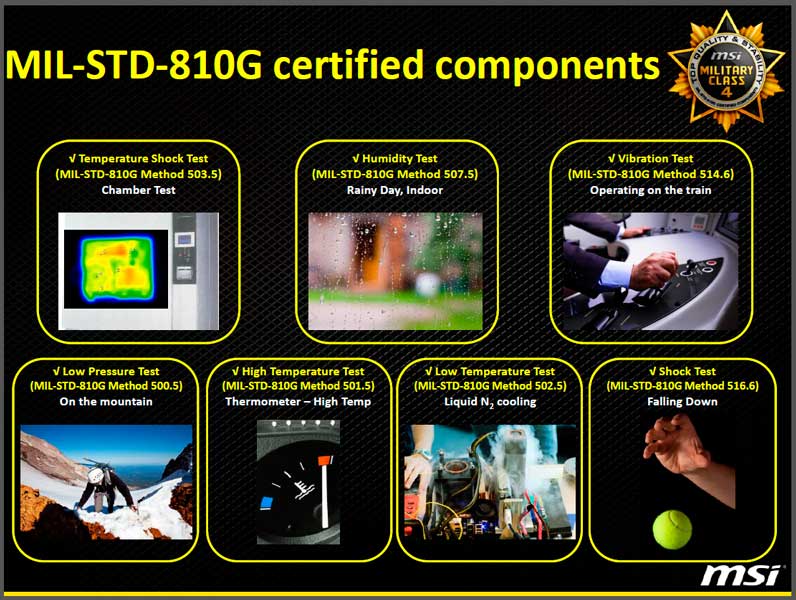
Military Class components
One of MSI's biggest marketing bullet points over the years has been its "Military class" branding now up to 4th generation.
All this really is, is MSI using components that have been subjected to tests under the MIL-STD 810G umbrella which describes "tailoring design and test criteria to the specific environmental conditions an equipment item is likely to encounter during its service life"(Wikipedia)
The specific tests MSI claims the components in its products have been put through are just definitions of test facilities and methodologies.
No commercial organisation or agency certifies compliance and it is up to the vendor to tailor the test methods to suit their products.
In the cause of their GPU and Motherboards, MSI claims their electronic components used have been tested against MIL-STD 810G 500 series environmental tests. In the documentation we have seen, there are no claims the entire product is engineered against these specs.
A copy of the test report was not provided with the GPUs, but from time to time a component test report is made available by MSI online.
While it is helpful to have 'tested' components rather than ones just picked from a catalogue and installed, this is not a deal breaking feature.
OC Kits
MSI claims by providing independent core voltage, memory and aux adjustments (not found on reference or vanilla 'OC' cards), the HAWK is not subject to Greenlight limitations but this is not the complete story.

100% power is linked to a 80 c limit to optimise thermals but using MSI's afterburner software power and temp can be adjusted independently if desired.
, LN2 mode enables 185% max power limit linked to a max temp limit of 95 degrees C.")
NVIDIA enforce limitations on their add in board partners to ensure their overclocked cards give a good experience and are stable.
OC-KIT also includes Voltage check points comprising a 2 pin standard keyed socket and cables which can take multimeter probes.
OC-KIT helps enforce the secondary reference methodology in electronics where you use a secondary measurement device (in our case a multimeter) to confirm a particular reading and rule out any bias in the measurement device.

Test Methodology
Test System Specifications
| Type | Model |
|---|---|
| Processor | Intel Core i7-3770K 3.5GHz (3.7 to 3.9GHz Turbo) |
| Motherboard | ASUS P8Z77-V Pro, BIOS 2104 |
| Memory |
16 GB - 4x 4GB Corsair Vegenance DDR3-2400 at 2400MHz C10 CMZ16GX3M4A2400C10 |
| Cooling | Intel Boxed Heatsink-Fan |
| AMD Graphics |
MSI RADEON R9 270X HAWK 2GB Part Number 113-C6310100-X15 BIOS Version 015.040.000.000.002887 |
| NVIDIA Graphics |
MSI GEFORCE GTX 760 HAWK 2GB Part Number P2004-0010 BIOS Version 80.04.BF.00.00 |
| System Drive | Seagate Barracuda ST3000DM001 3.5" 3TB SATA |
| Aux Drives |
Kingston HyperX 120GB SSD Seagate Backup Plus 1TB 2.5†External USB 3.0 WD My Book 3.0 2TB 3.5" External USB 3.0 PIONEER DVR-216 DVD-RW SATA |
| Case | Corsair Vengeance C70 Mid Tower |
| Power | FSP Aurum Series AU-750M 750 Watts Power Supply |
| Display | DELL Ultrasharp U2412M 24" LED backlit LCD Monitor |
| Operating System | Microsoft Windows 8.1 Professional 64bit with latest updates as of Dec 2013. |
| Graphics Driver |
AMD Catalyst 13.11 Beta NVIDIA GeForce 331.65 |
| Storage Driver | Intel Rapid Storage 12.9 |
Benchmarked Game Settings
| Software | Version | Test Settings |
|---|---|---|
| Alien V Predator | D3D11 Benchmark V1.03 | Texture Quality 3, Shadow Quality 3, Anisotropic 16, SSAO 1, Tessellation 1, Advanced Shadows 1, MSAA 4 |
| Battlefield 3 | 1.6 | Operation Swordfish - Checkpoint 1 to 2, Ultra Defaults, No Vsync |
| Batman Arkham City | 1.1 |
DX11:MVSS & HBAO, High Tessellation, Very High Detail, All details on, Normal Physx. DX9:No Dx11, High , No Physx |
| Bioshock Infinite | 1.1.24.21018 | Pre-sets Selected via benchmark menu |
| Blender | 2.67 Nightly | BMW1M-MikePan |
| Crysis | 1.2.1 | 1920x1200, Game Preset |
| Crysis 2 | Maximum Edition Version 1.9 |
Single Player Campaign 1920x1200,V-Sync and DX11 Enabled,System Spec Extreme |
| Crysis 3 | Hunter Edition Version 1.3 | Intro Mission, 1920x1200, FXAA, Very High Tex, Very High Profile, Medblur, Lens Flares |
| Cyberlink MediaEspresso | 6.7.3521_45765 | Both Hardware Encoding and Decoding Enabled for GPU, disabled for CPU big_buck_bunny_1080p_h264.mov |
| Deus Ex Human Revolution | 1.3.643.1 | 1920x1200, MLAA, 16x AF, Soft Shadows, High SSAO, High DOF, Triple Buffering, Post Processing, Tessellation |
| Dirt2 / Dirt 3 | 1.1 / 1.2 | 1920x1200, Ultra Pre-set, 4x MSAA |
| Futuremark Benchmarks | All patched to latest versions | |
| Grand Theft Auto IV | Title Update 7 | 1920x1200, Maximum details, 16x AFX, Detail distances 50,50,100, -norestrictions switch used if necessary |
| Handbrake | Build 5893 | |
| Just Cause 2 | Demo 1.0.0.2 | 1920x1200, Maximum Details on NVIDIA, 4x AA, 16x AF. |
| Lost Planet 2 | Benchmark | 1920x1200, Maximum Details Including Motion Blur, 4x AA. DirectX 11 Mode. |
| Metro 2033 | 1.01 | DX11 Very High Preset 4xMSAA 16xAF + DoF |
| Resident Evil 5 | Benchmark 1.0.0.29 | 1920x1200, Maximum Details Including Motion Blur, 4x AA. DirectX 10 mode |
| SPEC | SPECviewperf 11 | 1920x1200 , 4x AA |
| Street Fighter IV | Benchmark 1.0.0.1 | 1920x1200, Maximum Details except Ink,4x AA, 16x AF |
| Total War: SHOGUN 2 | 1.1 | All Ultra,MLAA, Soft Shadows, Tessellation, HDR,SSAO |
| Trackmania Nations Forever | 2.11.26 | 1920x1200, VHQ Pre-set, 4x AA 16x AF |
| Warthunder | 1.3 | Game pre-sets |
| World In Conflict | Demo 1.0 | 1920x1200, Maximum Details, 4x AA, 16x AF. DirectX 10 Mode |
Overall System Performance Benchmarks
With PC Mark 8 being in a transitional period, we still provide scores for PC Mark 7. The default test suite in PC Mark 7 is heavily biased to video encoding and reliant on the CODECs that are built into Windows 7. Because of this, when run on Windows 8 we see performance biased towards GeForce thanks to its more robust and polished 'NVENC' Video Encoding Processor.
PCMark 8 Incorporates OpenCL for the first time however in our testing we feel the feature was no optimally integrated in the first release of this benchmark.
PC Mark 8 incorporates both simulated test cases such as content creation and web, relying on the benchmarks own engine to run these. Additionally, PC Mark 8 can take advantage of Microsoft Office and Adobe Creative Suite and run benchmarks using these installed applications. The latter scores are independent of the main benchmark. The actual tests/tasks being run as well as he version of the Adobe app being used are very critical when considering
OpenCL performance as Adobe is constantly improving their OpenCL Support. This will change as both Adobe Creative Suite and PCMark 8 evolve. This review was our first use of PC Mark 8. Adobe has promised significant upgrades to Creative Suite plus their compute implementation also scales with number of GPUs.
It is important to note that CUDA and OpenCL are not 'uber accelerators', they can either offload real-time tasks to the GPU or it can offload highly parallel tasks, they cannot accelerate any random task.
The best demonstration of OpenCL is non-linear video editing where effects such as filters, graphics and colour adjustments can be applied in parallel in real time. The speed of the CPU in our test bed combined with the workload means both cards give similar performance in the benchmark, nulling the GPU's advantage.
We provide some other test suite overall scores such as Passmark 8 and Sandra 14 both of which incorporate graphics and compute testing and both of these tests are very similar thanks to the overall power of the GPUs.
3D Benchmarks
3DMark's Firestrike and Firestrike Extreme are now seen as the defacto performance metric for gaming GPUs. Here both cards are neck and neck, while is great to see this, this makes recommending one over another difficult just based on these scores.
We see a similar trend with the older benchmarks but these bias towards texturing/throughput or compute shader performance depending on the test.
Interestingly the still contemporary 3DMark 11 in extreme does show a significant delta in favour of NVIDIA. We have provided now superseded DirectX 9 and 10 based older 3DMarks for reference and historical purposes.
For Furmark on the GTX760, we saw temps of the low 80s and 60% fan speed while on 99% load. Boost averaged 1130-1160 and maxed out at 1228.
Driving and Racing Game Benchmarks
We cover this category With Dirt2,3 (both DirectX 11 but using different generations of the EGO engine) and Trackmania Forever, a popular free to play racer that’s purely DirectX 9 based
While these, and smaller cards can offer a great 60FPS Full HD gaming experience in DIRT, both cards are not able to sustain >120fps which is desired by some gamers for 120Hz or 3D gaming. Additionally we are only testing 1200p which is only 2.3 MegaPixels let alone higher eyefinity or surround resolutions, which will see a drop in performance.
Even the DX9 based Trackmania doesn't run away on these cards as it doesn’t have the capability to make the most of the GPU feature set.
Dirt 2 and 3 are AMD endorsed games.
Dirt 3 Benchmark Scaling
Dirt 3 uses random AI in its benchmark to ensure real world scenarios. From low to high res/detail Radeon offers better minimum frame rates and maximum rates are matched. Both cards will offer 60 fps gaming with v-sync and AA on at Full HD. Interestingly the game doesn't run away at 720p.
Flight and Sandbox Game Benchmarks
Just Cause 2 is a tech media favourite, although we use the steam demo. The benchmark run performs a day to night transition and terrain fly around. Despite being part of the NVIDIA game program, Radeon offers a >1.5x uplift in this test. This may be peculiar to either the DirectX code path or the fact we are using the demo.
Sleeping Dogs, part of AMD's Gaming Evolved program we hit a performance wall. The title is quite demanding and while our frame rate is sufficient for Full HD high quality gaming, again it is not sufficient for scaling to higher resolutions or 3D.
Warthunder is a free to play air combat title with some emphasis on a cinematic graphical experience.
We use the max preset for repeatability, however with manual tweaking it is possible to further increase graphical fidelity. Both GPUs on all runs exceed 120 FPS
First-Person Game Benchmarks
FPS is where things get interesting and where there is much user interest.
Alien vs Predator Benchmark is another media and vendor favourite using DirectX11 and dates back to AMD's Radeon 5000 release. Both cards achieve the same sub 60 FPS score at 'only' 1200p/2.3 Megapixels resolution
While Battlefield 3 (another AMD endorsed title) is important to gamers, we treat it as a data-point rather than focusing on it. It is important to focus on a gamut of titles of varying ages using different APIs and engines to determine overall experience and performance.
Both it and Bioshock Infinite at worst case Ultra settings offer a similar experience in the 50-70 FPS range, good enough for some, no good enough for others.
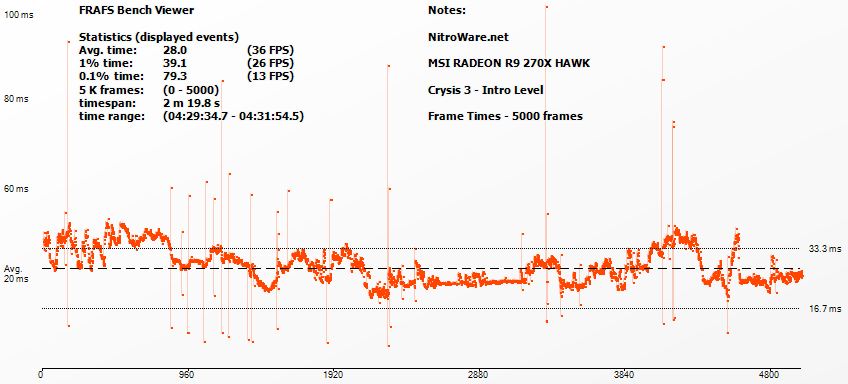
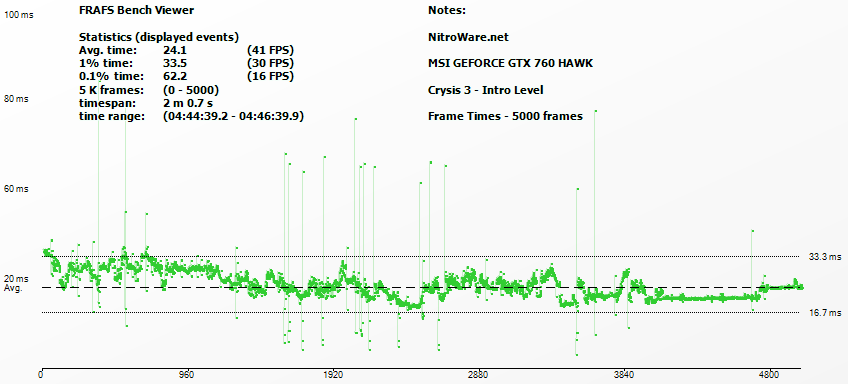
'Good old' Crysis 1 seems to favour the shader performance of the 270X, while Crysis 3's introduction map is a bit too much. We did play Crysis 3 for extended periods at these settings but further minor tweaking or using GeForce Experience for the GTX 760 will enhance game play further.
Without resorting to Crossfire, Deus Ex just runs away and we have sufficient frames to do various enhancements like 3D. Amusingly NVIDIA is faster in this AMD endorsed and optimised game.
We run two passes of Metro 2033 for a reason; Depth of Field is a frame rate killer. These Settings again are too much for 'buttery smooth' game play.
BioShock Infinite Benchmark Scaling
Bioshock's benchmark basically flys around its game maps in the usual panning fashion. With V-Sync off we see ridiculous maximum frame rates which do not correlate to real game play.
Taking the AVERAGE and MINIMUM FPS across Low to High Detail for Full HD gaming, NVIDIA GTX 760 offers consistently higher average frame rates while AMD RADEON R9 270X offers significantly higher minimum frame rates. Maxed out with depth of field this advantage is almost nullified, but GeForce does break the golden FPS mark.
Battlefield 3 Game Play Frame Times, Rates and Ranking
Frame Time
Easily calculated, for reference if we have 60 frame per second, each frame takes 16.67 milliseconds.
While both AMD and NVIDIA average 60FPS, the AMD card still has many runt frames (spikes in the graph,representing slow frames)
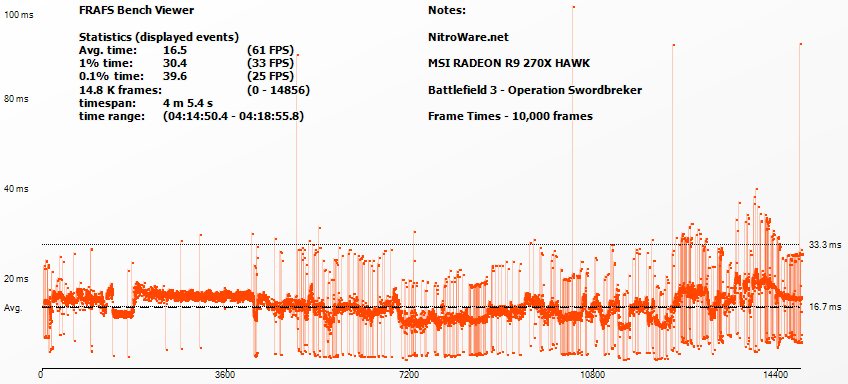
While NVIDIA not only has less runt frames but overall frames are faster.
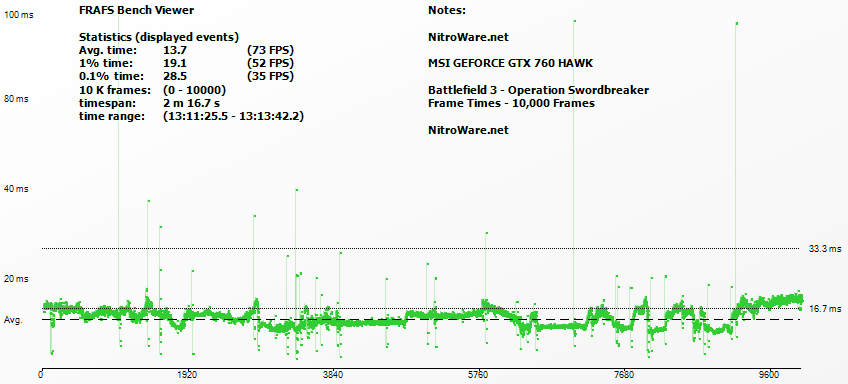
We are interested in a narrower,tighter graph plot which results in a smoother gameplay experience.
Ranking
![]()
![]()
Crysis 3 Game Play Frame Times, Rates and Ranking
Frame Time
Ranking
![]()
![]()
Third Person
Batman Arkham City at max details runs reasonably well on both cards at 1200p, however enabling PhysX and absolute extreme settings gives us a 30 FPS drop.
Lost Planet 2 is an NVIDIA endorsed title so no surprise with the results here
Resident Evil 5 is an older DirectX title and runs well on all platforms including Intel.
Arcade/Strategy
Street Fighter 4 is simply hilariously fast when run in an unlocked mode for benchmarking purposes. The Game is designed to run at locked 60 FPS so consistent performance is a must for this title. Not much to report for Shogun, both cards offer a good experience.
But I do want to mention the ageing World In Confl
ict Demo which uses DX10. I honestly expected significantly higher numbers in this venerable RTS title but time and time again its actual mission map benchmark provides us with realistic game play and AI simulation.
GPU Compute
'DirectCompute and OpenCL Benchmark' demonstrates the significance of what is already known, that Radeon is simply the choice when one needs GPU computing power especially in OpenCL, delivering up to 2x performance in OpenCL for this benchmark.
With Luxmark, having only selected the GPU under test and not the CPU, we see almost 3x between NVIDIA and AMD in OpenCL.
For Folding at Home, we were not able to run the CUDA test so we only compare using OpenCL and not CUDA optimisations.
Coin Mining
For AMD we used standard GUIMiner with OpenCL
| GPU | Algorithm | Overclock | GPU clock | GPU temperature | Fan speed | Hashing Speed | Total Power |
|---|---|---|---|---|---|---|---|
| R9 270X | SHA | Out of the box | 1150 MHz | 80c | 44% | 400 to 420 mhash/s | 250 Watts |
| GTX 760 | Scrypt | Out of the box | 1111 MHz | - | - | 179 to 205 khash/s | 242 Watts |
For reference, the HD 4600 Integrated GPU in Intel's current flagship consumer CPU, the i7-4770K only acheives 5.9 mhash/s in Guiminer/OpenCL.
For NVIDIA, Since CUDA generation GeForce GPUs are poor at standard mining algorithms, we tried the 'new' Cudaminer for Scrypt based mining by Christian Buchner and got better results from this software
C:\guiminer-scrypt-64-004\cudaminer>cudaminer --benchmark -C 2
*** CudaMiner for nVidia GPUs by Christian Buchner ***
This is version 2013-11-20 (alpha)
based on pooler-cpuminer 2.3.2 (c) 2010 Jeff Garzik, 2012 pooler
Cuda additions Copyright 2013 Christian Buchner
My donation address: LKS1WDKGED647msBQfLBHV3Ls8sveGncnm
[2013-12-02 05:04:29] 1 miner threads started, using 'scrypt' algorithm.
[2013-12-02 05:04:29] Binding thread 0 to cpu 0
[2013-12-02 05:04:49] GPU #0: GeForce GTX 760 with compute capability 3.0
[2013-12-02 05:04:49] GPU #0: interactive: 0, tex-cache: 2D, single-alloc: 1
[2013-12-02 05:04:50] GPU #0: Performing auto-tuning (Patience...)
[2013-12-02 05:06:05] GPU #0: 204.80 khash/s with configuration K48x4
[2013-12-02 05:06:05] GPU #0: using launch configuration K48x4
[2013-12-02 05:06:05] GPU #0: GeForce GTX 760, 6144 hashes, 0.06 khash/s
[2013-12-02 05:06:05] Total: 0.06 khash/s
----------------------------------
[2013-12-02 05:07:08] GPU #0: GeForce GTX 760, 903168 hashes, 179.52 khash/s
[2013-12-02 05:07:08] Total: 179.52 khash/s
Video Encoding
Our video encoding testing comprises of comparing CPU only Video Encoding versus GPU accelerated Video Encoding over several tests.
AMD, INTEL and NVIDIA all now offer full hardware video encode acceleration which depending on the implementation is either optimised for real-time encoding or highly accelerated encoding.
Our Movie Maker 2012 test comprises a simple project were we import Big Buck Bunny 1080p sample clip, add some titles, transitions, trim the video and export the finished result. Movie Maker 2012 utilises DirectX and through this the GPU's video engine. AMD's engine, called VCE is optimised to be used in conjunction with OpenCL or for real time encoding and is almost twice slower than AMD or NVIDIA, which is unacceptable for a full bitstream h264 encoder in hardware.
Moving on to Cyberlink MediaEspresso, comparing GPUs suing an A-B test, although there is inconsistent with how MediaEspresso uses GPU acceleration, AMD is constantly the slowest here and is significantly slower than CPU only encoding. Again unacceptable.
During its 2013 developers conference, AMD described how it has applied two of its engineers to rewrite both the popular Handbrake and x264 video encoders in an effort to not only optimise for their products but provide significant speedup via OpenCL.
Only specific parts of the encoding pipeline such as scaling are accelerated using OpenCL in Handbrake, however we do see a significant speed up of 40 frames per second over CPU only encoding with Radeon. So Handbrake and OpenCL finally work. Intel QuickSync has always been ridiculously fast in handbrake thanks to a custom codec suited for the hardware unit.
The Normal preset does not scale the image so we see no speed up.
Web
3D Graphics and GPU acceleration is actually an important part of the modern desktop experience. All major web browsers on all computing platforms are now have their graphics accelerated by the GPU.
HTML5 Fishbowl is a synthetic brute force benchmark and we take the highest number of fish observed at 60FPS, the frame-rated will drop subsequently.
Peacekeeper is Futuremark's web browsing/HTML5 benchmark. A significant delta is observed here for what some may consider a CPU bound test, but sprites, vector graphics and video playback are heavily featured.
WebVizBench is another benchmark that Microsoft liked to show off during IE 11 release timeframe and is an excellent showcase of what the GPU can do for the modern web browsing experience. Both cards are very close here. Webkit SunSpider is the typical CPU bound browser
JavaScript test so the GPU has null affect here., However, we do see a difference in the similar benchmarks from Mozilla and Google for their browsers respectively.
Professional Graphics
SpecviewPerf 11 showcases professional CAD and 3D Modelling applications which are supported for professional branded cards such as FirePro or Quadro however some users may run these on consumer cards plus this is an industry standard benchmark so we include this as a data point.
Radeon R9 270X provides significant performance uplift in these professional applications in its consumer form. Note we run with 4x anti-aliasing which is not the default and would have an effect on the result.
Photoshop CS5 uses OpenGL for image manipulation but it was not until a later version that was not released in time for our review that full hardware acceleration via OpenCL was made available.
Using the standard now aging DriverHeaven Photoshop benchmark, both these 'mid range performance' GPUs stretch Photoshop CS5. A new GPU may not help users of the older versions of this app.
GPU support in the 3D Modelling tool , Blender is a work in progress, as such CUDA is reliable and fast yet OpenCL is not. At time of our testing NVIDIA was the only good choice for blender users. OpenCL is broken in this application with Radeon yet a 2x speedup using CUDA over OpenCL and 3x speedup over CPU only rendering.
Successor to the favourite of all, Cinebench 11.5, based on a rendering engine used in the real world yet the significance of being overrated. Cinebench 11.5 based on the older Maxon engine shows us
Radeon has superior OpenGL performance of almost 1.5x, however the newly released Cinebench 15 improves optimisation nd support for different vendors. Here the OpenGL of both MSI cards is within a few % of each other. For users of this software, upgrade your software not your hardware.
Power
One area of key interest to PC enthusiasts and power users is power consumption, especially with the larger GPUs we are now accustomed to .
In typical use at their out of box clock speeds, both overclocked MSI are in the same ballpark in a typical windows use case, even when benchmarked with two versions of 3DMark ! It helps that both these cards have been deliberately tuned by MSI and use almost exactly the same cooling solution.
Where tracks diverge is Power consumption, the compute oriented Radeon just runs away when we apply a power virus using Furmark and as for bitcoin mining, the higher performing Radeon draws more power where as GeForce wastes power here.
Stock speeds, Taken at the half way mark during the Furmark burnin test
| GPU | Core Clock | Temperature | GPU usage | GPU Power | Fan Speed |
|---|---|---|---|---|---|
| R9 270X | 1150 MHz | 88 c | 99% | - | 76% |
| GTX 760 | 1123 MHz | 80 c | 99% | 62.4% | 62% |
Out of box power draw should not and is not a problem with typical applications.

Overclocking
For this review, our overclock testing comprised of two main methods. Real-world game play testing using Crysis 2 and light benchmark testing using Furmark, GPU-Z and 3DMark’s Firestrike test.
For cards that change their performance in real time, such as NVIDIA's Kepler and AMD's Hawaii chips, burn-in using a power virus such as Furmark can cause the card to fail-safe and drop out of boost as it thinks it is over-loaded. Whereas extended play with a game at a particular overclock will not exceed the limits of the GPU.
In actual gameplay, the GPU will not be limited and we can monitor the boost speed in game. Pass/fail is if gameplay is stable for an extended period. If we experience a lockup or freeze quickly within a few seconds or minds we mark that as a fail without re-testing that particular speed and moved on to higher settings.
Due to time and brevity, we could not replicate every combination of test, mode and clock speed
-
For the Default mode switch, we first testing the overclock using a synthetic stress test such as GPU-Z and then ran 3DMark Firestrike. Subsequently, In-game Crysis 2, progressing through the game and not repeating any, typical of a gamer. Session time varied between 20mins up to 2 hours especially if the test was stable. We monitored the vital statistics of the GPU using MSI Afterburner during these tests.
-
For LN2 mode switch, we first testing the overclock using a synthetic stress test such as GPU-Z and Furmark and then ran 3DMark Firestrike.
All adjustments performed using MSI Afterburner 3.0 beta 17, with overlays enabled so we could monitor the card. Beta 17 added voltage controls and support for the new HAWK 2013 models.
Although we Covered Crysis 3 performance earlier in the review, we used the older Crysis 2 in this particular test for several reasons. It uses an older, less optimised version of CryENGINE and its DirectX 11 support is not as robust. Crysis 3 has better multi-threading and optimisation.
It does not serve much purpose to have a overclocked card fail during gaming and we chose to use a play through of the single player campaign as a real world stability test.
Overclocking the AMD card is straight forward, despite having a 'turbo' speed of 1150 MHz, which AMD is careful to not disclose any non turbo speed and throughout our evaluation we perhaps only noticed the 270X drop out of Turbo and throttle perhaps once, to 1100 MHz including during heavy gameplay.
However, overclocking the NVIDIA GTX760 requires some consideration.
Out of the box the MSI HAWKs are heavily overclocked. 130-140 MHz factory overclock is impressive by itself, but the LN2 switch position will set the reference GTX760 clock speed of 980 MHz base, 1033 MHz boost and 6008 MHz memory.
3DMark Firestrike
AMD RADEON R9 270X
| 270X 3DMark Firestrike | Out of Box | Test Config A | Test Config B (LN2 Mode) |
|---|---|---|---|
| Base Clock | 1150 MHz | 1225 MHz | 1300 MHz |
| Memory Clock | 1400 MHz | 1450 MHz | 1500 MHz |
| Power Limit | 0 % | +20 % | +20 % |
| Vcore Voltage Offset | 0 | +50 millivolts | +100 millivolts (1.3V) |
| Memory Voltage Offset | 0 | +30 millivolts | +50 millivolts |
| Aux Voltage Offset | 0 | +30 millivolts | +50 millivolts |
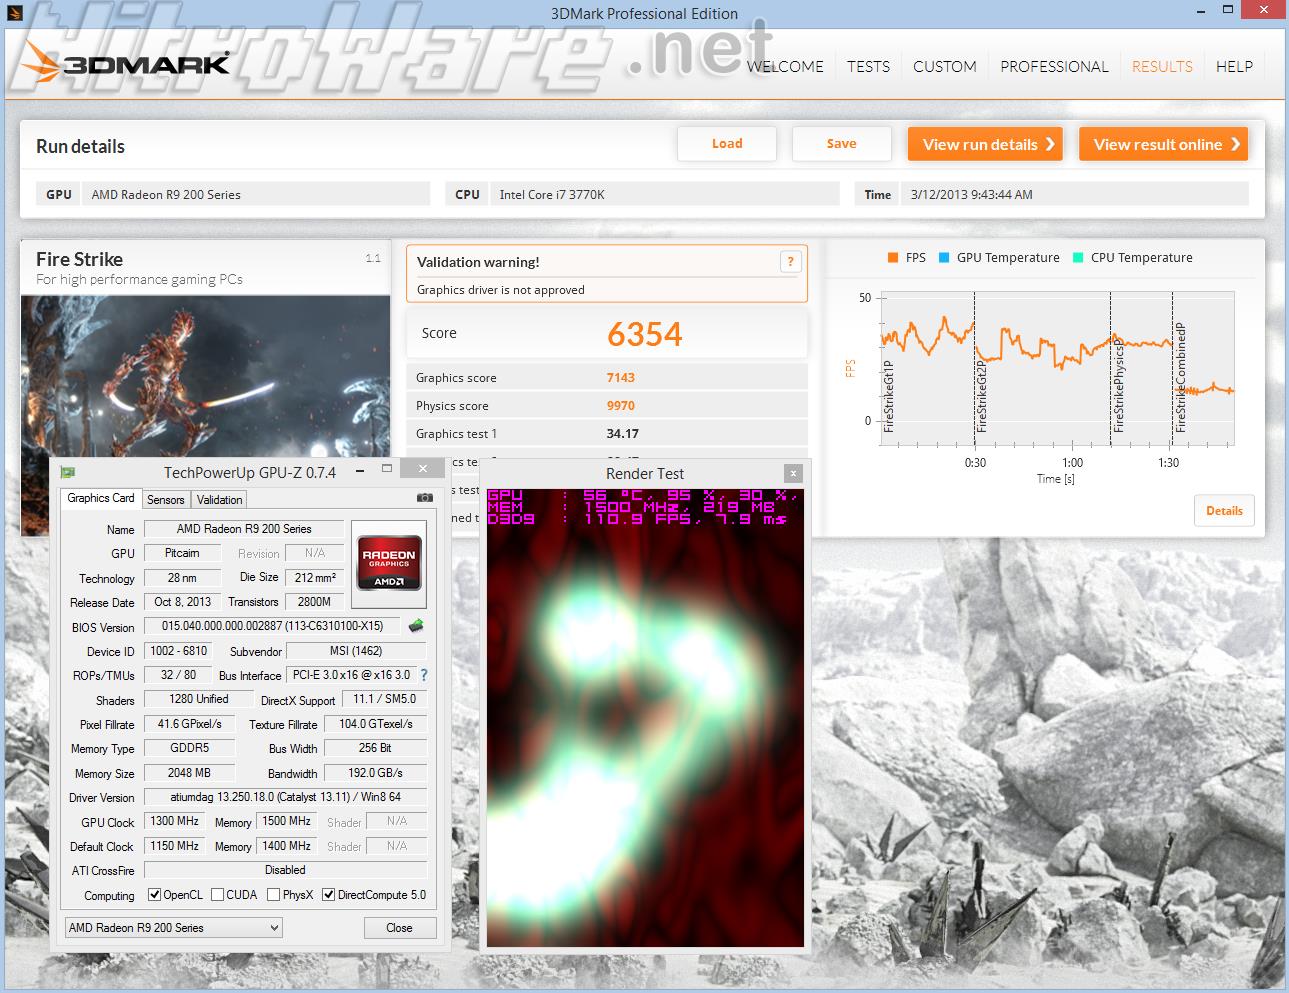
| Firestrike Score (Increase) | 5818 | 6065 (4.2%) | 6354 (9.2%) |

NVIDIA GeForce GTX 760
| GTX760 3DMark Firestrike | Out of Box | Test Config A | Test Config B (LN2 Mode) |
|---|---|---|---|
| Base Clock | 1111 MHz | 1176 MHz (+66) | 1200 MHz (+220) |
| Boost Clock | 1176 MHz | 1242 MHz (+66) | 1242 MHz (+66) |
| Overboost Clock | 1320 MHz | 1346 MHz | |
| Memory Clock | 1502 MHz | 1652 MHz (+300) | 1652 MHz (+300) |
| Power Limit | 100 % | 103 % | 185 % |
| Vcore Voltage Offset | 0 | + 12 millivolts | + 12 millivolts |
| Memory Voltage Offset | 0 | + 30 millivolts | + 30 millivolts |
| Aux Voltage Offset | 0 | + 20 millivolts | + 20 millivolts |
| Firestrike Score (Increase) | 5983 | 6337 (5.9%) | 6467 (8.1%) |
| Total Power Consumption(Increase) | 270 Watts | - | 295 Watts (9.3%) |
Crysis 2
AMD RADEON R9 270X
| R9 270X Crysis 2 | Test Config A | Test Config B | Test Config C | Test Config D |
|---|---|---|---|---|
| Base Clock | 1200 MHz (+50) | 1225 MHz (+75) | 1250 MHz (+100) | 1300 MHz (+150) |
| Memory Clock | 1450 MHz (+50) | 1450 MHz (+50) | 1450 MHz (+50) | 1450 MHz (+50) |
| Power Limit (%) | +20 % | +20 % | +20 % | +20 % |
| Vcore Voltage Offset | +31 millivolts | +50 millivolts | +50 millivolts | +50 millivolts |
| Memory Voltage Offset | +30 millivolts | +30 millivolts | +30 millivolts | +30 millivolts |
| Aux Voltage Offset | +30 millivolts | +30 millivolts | +30 millivolts | +30 millivolts |
| OC Pass/Fail | PASS | PASS | FAIL | FAIL |
NVIDIA GeForce GTX 760
| GTX760 Crysis 2 | Test Config A | Test Config B | Test Config C | Test Config D |
|---|---|---|---|---|
| Base Clock | 1176 MHz (+65) | 1181 MHz (+70) | 1177 MHz (+66) | 1176 MHz (+65) |
| Boost Clock (MHz) | 1241 MHz (+65) | 1246 MHz (+70) | 1242 MHz (+66) | 1241 MHz (+65) |
| Over-boost Clock | 1320 MHz | 1319 MHz | 1333 MHz | 1320 MHz |
| Memory Clock | 1652 MHz (+300) | 1652 MHz (+300) | 1652 MHz (+300) | 1652 MHz (+300) |
| Power Limit (%) | 103 | 111 | 111 | 111 |
| Vcore Voltage Offset | +12 millivolts | +12 millivolts | +12 millivolts | +12 millivolts |
| Memory Voltage Offset | +30 millivolts | +10 millivolts | +12 millivolts | +20 millivolts |
| Aux Voltage Offset | +20 millivolts | +10 millivolts | +12 millivolts | +20 millivolts |
| OC Pass/Fail | PASS | FAIL | FAIL | FAIL |
| Notes |
Boost reset twice to 900 and 1111 |
Quick Freeze | Game Crash | Freeze after ~20 mins |
Furmark
Game loads are dynamic, where-as power viruses such as Furmark or Kombuster help us determine worst case temperature and power draw as well as synthetically test stability.
So how did the N760 HAWK perform in Furmark with LN2 Mode switched on for a 1200 overclock and 185% power limit?
The result was astonishing.
| GPU | Core Clock | Boost Clock | GPU Temperature | Furmark Frame Rate | Furmark Score | Total Power |
|---|---|---|---|---|---|---|
| GTX760 | 1200 MHz | 1346 MHz | 92 c | 78 FPS | 4710 | 377 Watts |
By maxing out the card's voltage and power settings, Total system power draw was 1.4 times what was consumed by Furmark at stock settings. Something to consider when shopping for a Power Supply suited for such a card.
At 185% and 1200MHz, the GTX760's linked temp limit is raised to 95c but even with this limit, during Furmark 95 degrees c was never exceeded.


Coin Mining
As bitcoin specifically is not very video memory intensive, we should see near linear increases in hashing throughput if we overclock.
AMD
The following results are from a standard GUIMiner setup with OpenCL mining
| 270X Bitcoin Performance | GPU clock | GPU temperature | Fan speed | Hashing Speed |
|---|---|---|---|---|
| Out of the box | 1150 MHz | 80c | 44% | 400 to 420 mhash/s |
| Maximum Overclock at 1.3 volts | 1300 MHz | 90c | 72% to 79% | 450 to 460 mhash/s |

NVIDIA
Since this is the GK104 first generation Kepler, Bitcoin is not its strong suit, however 'CUDAminer' does prove benefit especially at the TDP and cost of this card.
Price, Availability and Support
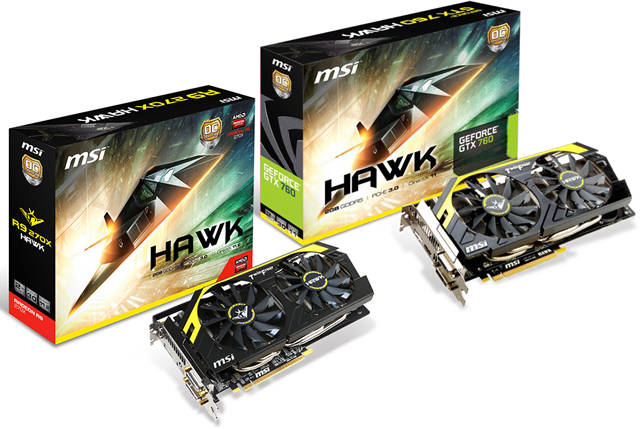
MSI RADEON HAWK
The cheapest MSI R9 270X HAWK in the Australian channel according to staticice.com.au as of 17-MAR-2014:
| Region | Local Price (inc Tax) | Price in AUD | Source |
|---|---|---|---|
| AU | $ 279 AUD | - | staticice.com.au |
| US | Out of Stock | - | newegg.com |
| CA | $ 260 CAD | $ 260 | NCIX.ca |
| EU | € 182 EUR | $ 280 | geizhals.at |
| UK | £ 166 GBP | $ 307 | Scan.co.uk |
- Since this is an ultra-enthusiast product and subject to artificial increase nicknamed "Australia Tax", AUS prices can reach up to $370 which is nearing R9 280X (HD 7970) pricing and significantly more than USA
MSI GEFORCE HAWK
The cheapest MSI 760 HAWK in the Australian channel according to staticice.com.au as of 17-MAR-2014:
| Region | Local Price (inc Tax) | Price in AUD | Source |
|---|---|---|---|
| AU | $ 359 AUD | - | staticice.com.au |
| US | Out of Stock | - | newegg.com |
| CA | $ 350 CAD | $ 350 | NCIX.ca |
| EU | € 229 EUR | $ 375 | geizhals.at |
| UK | £216 GBP | $ 353 | Scan.co.uk |
- If we consider $360 for the HAWK N760, this is significant to note as in 2014, the GTX 770 has been on sale for $399 US.
- The AMD based HAWK delivers better bang for buck.
Both MSI cards have a three year warranty, which is void if the Twin Frozr cooler is removed.
Verdict
MSI may think the nighthawk fighter, implying stealth and surgical precision, inspires their HAWK cards but with their huge power delivery capability and overclocking potential, these graphic cards feels more like a bomber than a fighter.
Although not be fitted with the fastest GPU in the fleet, the card's brute force and voltage controls will make most enthusiasts feel comfortable enough to throw everything the card can give to reach their target of ever-higher performance and overclocks.
Both the Radeon R9 270X HAWK and GTX 760 HAWK can make an enthusiast feel like a pro overclocker without being too intimidating, yet still remain relevant to the ultra-elite overclocker.
We were sceptical of the N760 HAWK at first, assuming the two 8 pin connectors was a marketing gimmick and overkill for a performance mid-segment GPU with only a 170W TDP but once we understood the product's tweaking ability we were on-board with the idea and saw some impressive power consumption and overclock figures.
Which MSI HAWK is right for you depends on your brand loyalty or budget. Although there is a price difference, consider that NVIDIA is frequently changing their game bundle and support Shadowplay plus somewhat better game smoothness and frame rates while the AMD card is cheaper and offers better compute performance. AMD does offer 'raptr' as a value add competitor to NVIDIA GeForce Experience but at this time NVIDIA provides a better software suite for gamers.
The MSI R9 270X HAWK delivers great bang for under $300 bucks
For those who not have experienced NVIDIA Shadowplay, here is our sample of Crysis 3 recorded using the technology.
Pros/Cons
MSI R9 270X HAWK
Pros:
- Card Aesthetics and visual design, F-117A Nighthawk motif will be liked by technology, aviation and military enthusiasts.
- Sturdy mechanical build
- Twin Frozr IV advanced cooler provides good cooling and acoustics.
- Over-engineered and components PCB which not only allows for good overclocks, but encourages it with ease and * reliability
- Requires only standard two 6-pin power connections
- Phase LEDs on top of card
- Value for money, small premium above lower spec MSI 270X
Cons:
- OC-Kit connectors designed for open test bed and in bad position for case use
- Poor accessory bundle for an enthusiast-oriented card
- Naming of 'LN2' overclock mode somewhat misleading and discouraging
- Memory not overclocked
- No Game bundle
- Too similar to the HAWK HD 7870 and not a recommended upgrade from it
MSI GTX 760 HAWK
Pros:
- Card Aesthetics and visual design, F117A Nighthawk motif will be liked by technology, aviation and military enthusiasts.
- Sturdy mechanical build
- Twin Frozr IV advanced cooler provides good cooling and acoustics.
- Over-engineered and components PCB which not only allows for good overclocks, but encourages it with ease and reliability
- NVIDIA PhysX, GeForce Experience and Shadow Play software.
- NVIDIA game bundles.
Cons:
- OC-Kit connectors designed for open test bed and in bad position for case use
- Poor accessory bundle for enthusiast-oriented card
- Naming of 'LN2' overclock mode somewhat misleading and discouraging
- Memory not overclocked
- High Price for the GTX 760 HAWK, R9 270X HAWK provides better value for money.
- No Phase LEDs like the AMD HAWKs
- Not completely superior to the competitive AMD 270X HAWK
- Overclocking when using out of box BIOS settings is restricted, likely by NVIDIA's policies