3D Benchmarks - Stock and Overclocked Performance
We start off with synthetic benchmark tests to provide a comparable score between cards and reviews.
GTX 1050 is within 5% of the already factory over clocked GTX 950 depending on the test which is fine as the GM206 powered 950 has 768 'Maxwell' cores and uses auxiliary power, where our GP107 powered 1050 uses 640 'Pascal' cores and relies on bus power only. But just in raw GPU horsepower, there is no way these smaller cards can match or beat the heavy factory over clocked GTX 960 with its 1024 Maxwell cores.
Especially considering the lower load benchmarks such as cloud gate and ice storm which are intended for lower specification PCs and laptops we can see 950 is slightly ahead than 960 in some tests. GTX 1050 is newer and is more efficient so why is this so? It comes down the to the properties and specs of the GTX 950 we used. Not only is it an over clocked card but on paper, it is slightly faster than 1050 in texture throughput but 1050 is slightly faster pixel throughput, a trade off. These older tests rely less on pixel shaders and more on pushing textures.
A more proper comparison would be to have a reference GTX 950 which we don't have on hand and I under clock the Gigabyte sample we have it is not an accurate representation of that board's performance. It is already running slower than it can out of the box with a higher set of clock speeds available to the end user, who can enable them with Gigabyte OC GURU software.
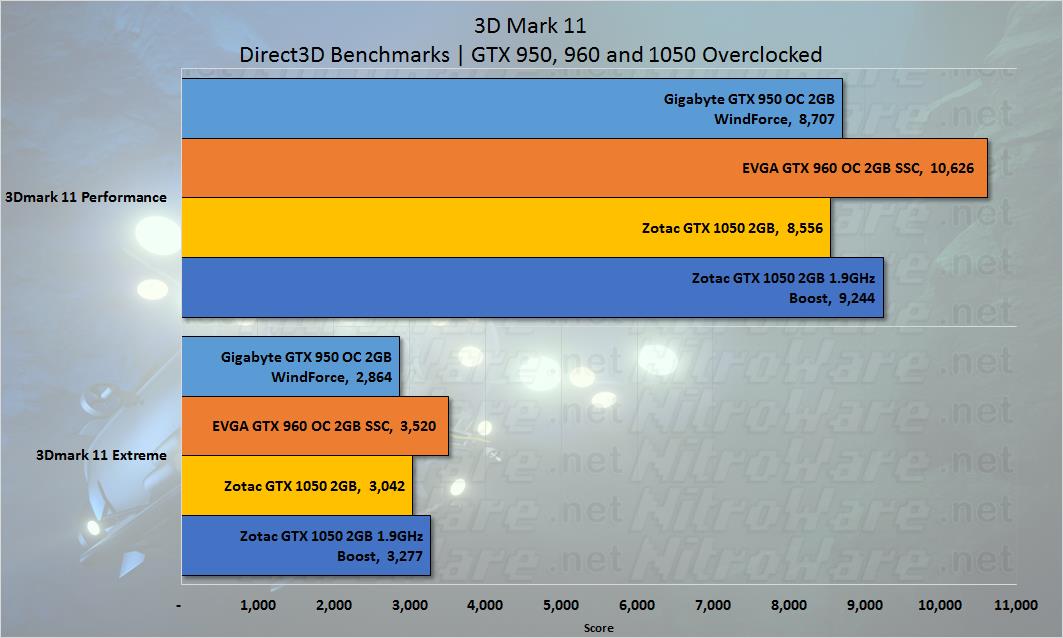
3DMark
In 3DMark, over clocking the core gave us the most benefit but we still cannot match the 960. The EVGA SSC clocks are just too high being a high end over clock model and of course has almost 1/3rd more cores. But for a free overclock, a score increase of between 500 to 1000 points is very nice.
3DMark 11 uses a native DirectX 11 engine designed to make extensive use of all the new features in DirectX 11, making it the best way to consistently and reliably test DirectX 11 under game-like loads
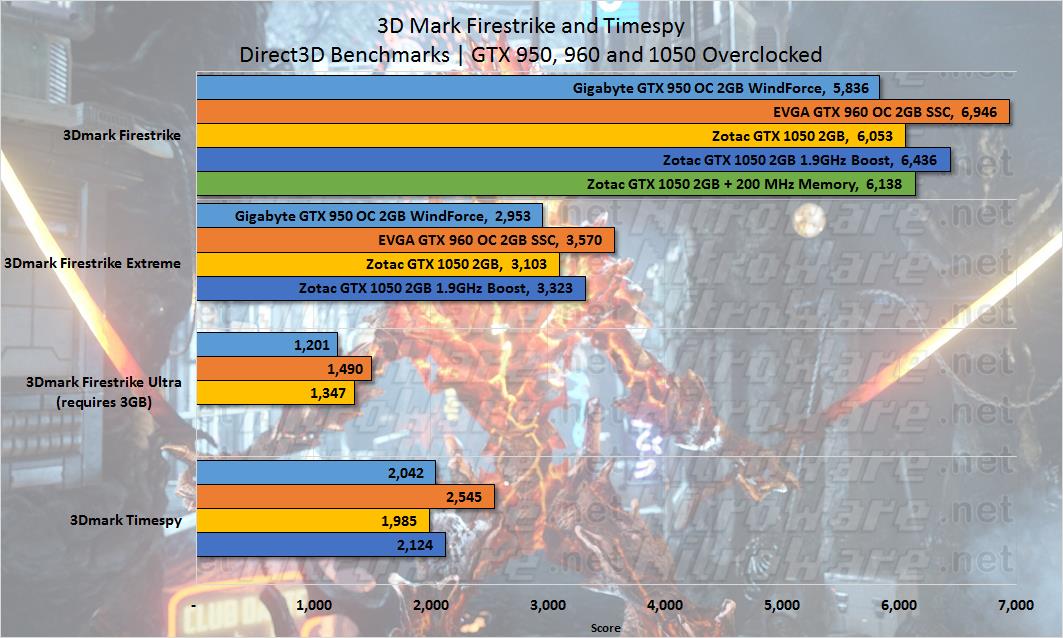
Fire Strike is a DirectX 11 benchmark for high-performance gaming PCs. Fire Strike includes two graphics tests, a physics test and a combined test that stresses both the CPU and GPU
3DMark Time Spy is a new DirectX 12 benchmark test for Windows 10 gaming PCs. Time Spy is one of the first DirectX 12 apps to be built "the right way" from the ground up to fully realize the performance gains that the new API offers. With its pure DirectX 12 engine, which supports new API features like asynchronous compute, explicit multi-adapter, and multi-threading.
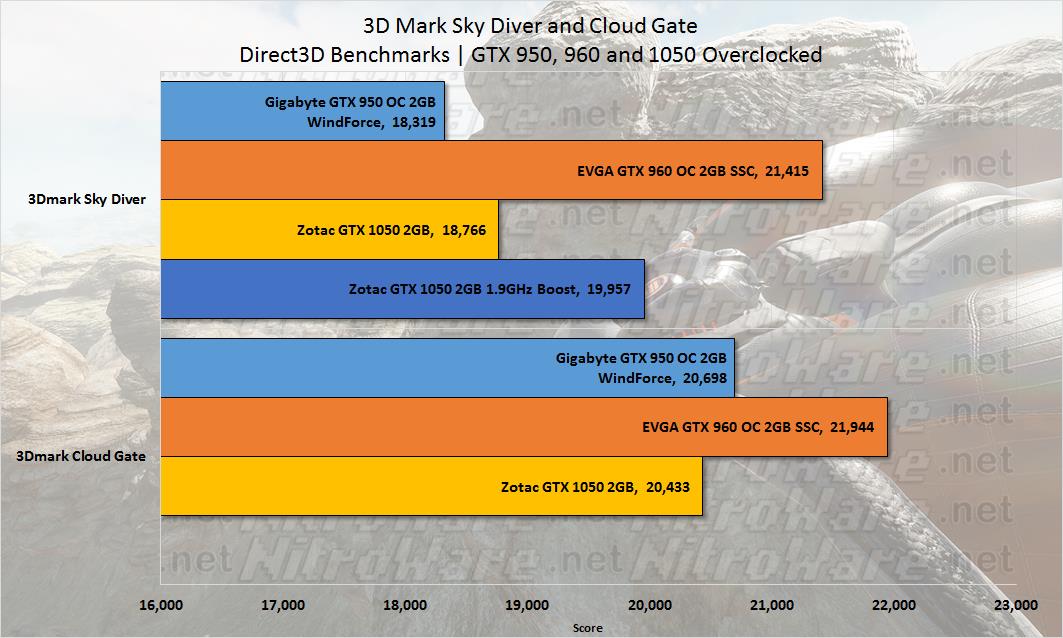
Sky Diver is a DirectX 11 benchmark that is ideal for testing mainstream graphics cards, mobile GPUs, integrated graphics and other systems that cannot achieve double-digit frame rates in the more demanding Fire Strike test.
Use Cloud Gate to test the performance of notebooks and typical home PCs with DirectX 10 compatible hardware.
Unigine Heaven and Valley
Moving on to the ubiquitous Unigine, also included as a data point that can be compared between reviews.
Both Unigine heaven and valley reinforce what I said earlier, the more efficient card that is able to push pixels faster wins out especially at higher resolutions.
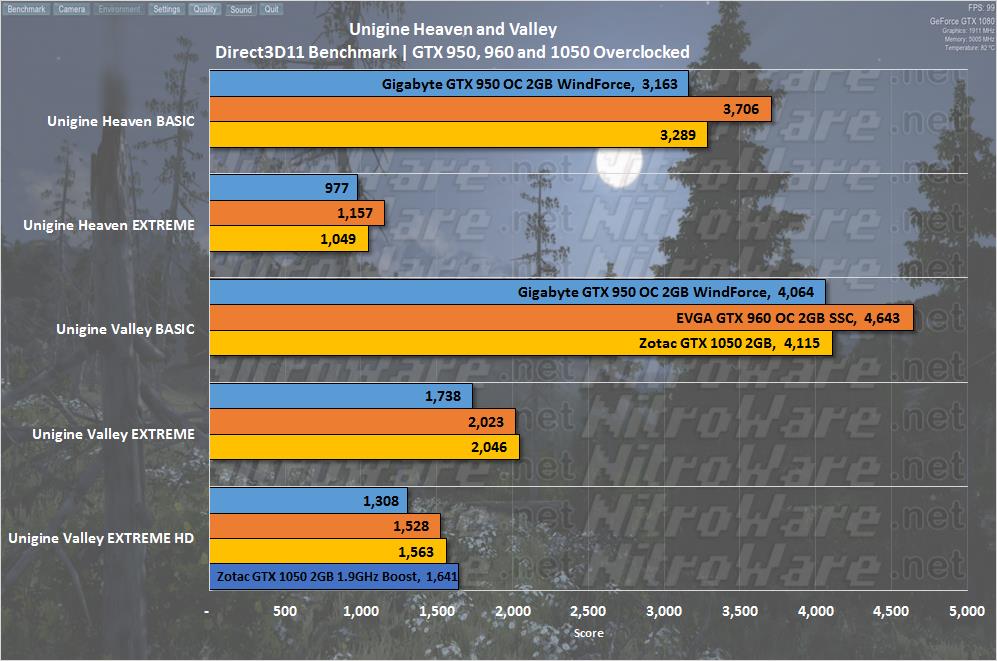
Looking at Unigine Valley, it is one of the tests that favours pascal over Maxwell, especially at higher resolutions and detail levels. We can only point to the more efficient CUDA core architecture and memory/colour compression that gives these results. Unigine is not a game so we should not think too much here. Valley comprises mostly of forest, trees and foliage implemented through many .DDS files (DirectX Texture Files) so there is a lot of redundant duplicated data than can be reduced with efficient compression.
Although we set boost to 1.9GHz, the nature of NVIDIA GPU Boost technology is that it will go even higher provided temperature and power are not exceeded. We saw 1050 running at 2126 in Valley at under 60 degrees C. !

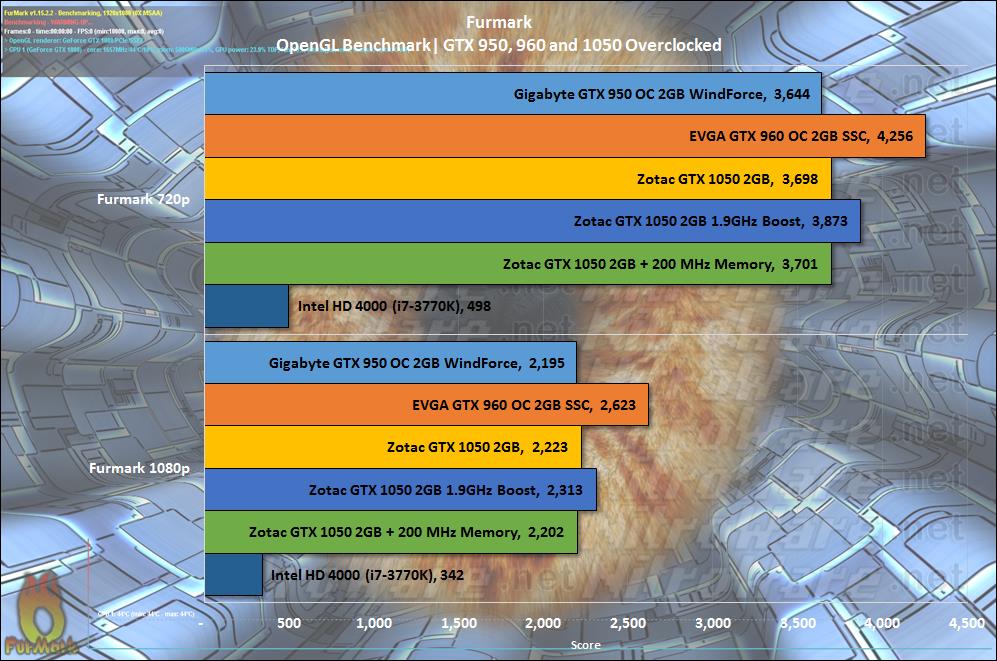
Furmark
I provide Furmark scores as a courtesy to our readers as some die-hards insist and rely on this test both for performance and temperature/power burn-in. A better comparison is a synthetic tool which supports both Direct3D and OpenGL to compare the efficiency of the APIs there, Unigine does support both but the GL path is not very popular and a small number of games also provide both.
Not much more to say here about Furmark performance and as stated we stick to 1080p for this review despite 1440p and 4k being available in Furmark.
Furmark shows what 3DMark also showed us, over clocking is still not enough and puts us halfway between the stock 1050 and the 960. If only we had a 1050 Ti on hand.
Intel HD 4000 results in furmark are just embarrassing, however keep in mind this is a 2012 flagship Intel Integrated Graphics. The newer ones are better but not light years ahead.
Temperature wise 1050 held up very well in Furmark:
| GPU Model | GPU Temp | GPU Power Level | GPU Core Clock Speed |
|---|---|---|---|
| GTX 950 | 62 c | 100% | 1151 MHz |
| GTX 960 | 76 c | 95% | 1417 MHz |
| GTX 1050 | 64 c MAX | 90% | 1447 MHz AVG |
| HD 4000 | 46 c | 18.5 Watts | 1150 MHz |
The 950 at moderate temperatures but below min boost clock.
Our 960 is a heavily overclocked EVGA SSC edition so we would expect somewhat high temps, despite the overkill heatpipe cooler on the card. These temps are OK given we see 83c constant on reference/founders cards typically.
1050 - We see 90% power here because drawing power from the slot, to keep a margin of error on its side. I took the average boost speed for this card because due to its bus powered nature the instant boost speed in furmark varied significantly by the second giving a zigzag chart in GPU-Z's sensors. Taking instant result wasnt right based on the results i was seeing. Basically the board was hitting its buffer stops, and a much stronger board design that could supply more power to the GPU and cool it better would extract more performance from GP107.

HD4000, low temperatures but we get a report of the actual watts used by the Intel Core not a percentage, due to the way the units within the Intel GPU are designed, so metering differs too.
When we overclocked the 1050 we still saw temps in the 50-60s range.